Hypothesis:
If the person being tested is of younger age, then they will have higher accuracy in
hearing.
hearing.
Design
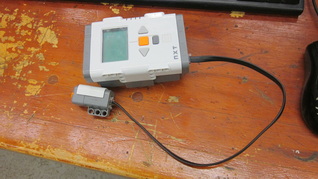
This is the design we used during this challenge. It is very simple with just an NXT programmer with a touch sensor attached to it. We didn't need to use anything else since the robot was not being used for any kind of fancy tasks.
Program
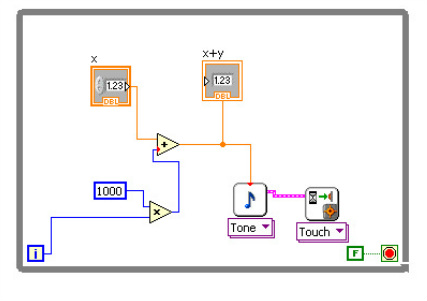
This program was able to tell our robot to play a tone when the touch sensor was pressed. This tone was changed in incraments of 1,000 starting at 440 Hertz as we tested the hearing of people at our school. This made it so our robot could play a pitch up to 14,400 Hertz. We tested both students and teachers to get a range of data.
Data
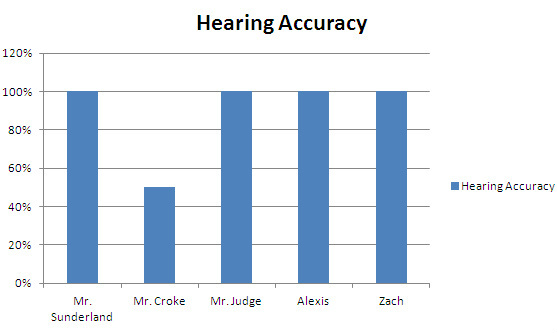
This was the data that we recieved. The majority of the people we tested had perfect hearing. One person did not have perfect hearing and recieved a 50% when taking the test. This still proves our hypothesis correct because all of the students and younger teacher had perfect hearing. Although, there were some other variables that probably had an impact on our testing. The person who had poor hearing had a job that involved being around loud noises. This most likely had a negative impact on his hearing over the years which is shown on the graph by how he did with the test. I believe there are instances where a student also could be affected and have bad hearing, such as if they listen to their music too loudly. We although did not run into this variable when testing as shown in the graph because the students we tested still had perfect scores. If this occurred, it would have proven our hypothesis to be incorrect. Understanding these variables of the data shows that the data we collected, which is scarce, is not enough to come up with a very accurate conclusion. With the many variables, a lot could happen to change these results, which with a larger source of data would become more accurate.
